Some years back, I talked with a farmer who’d raised two sons. One year he went to the bank for a loan on some farm ground, and he took both sons along, teenagers then. When they were done, one walked out talking about how nervous the whole thing made him. The other said, “Hey, that was pretty slick. Pretty easy.”
Those two teenagers grew up, and this isn’t a surprise ending: One avoided debt like the plague and tried to pay cash whenever he could, even in his business. The other struggled to save money his entire life.
That farmer and his wife raised those two boys the same way. They grew up with the same parents and teaching and influence, on the same farm, through the same turmoil and downturns and low prices and boom years. But they came up opposite in how they handled debt in their adult lives.
Far beyond that family, it’s obvious farmers all over the state — and the nation — have a different level of comfort with debt and its inherent risk. An ag banker once described it to me as a “chicken point,” and every farmer’s chicken point differs. What level of risk are you comfortable with? At what point can you no longer sleep at night?
USDA and Illinois Farm Business Farm Management data tell us that farm debt in Illinois has been increasing since 1991. Those same economists project 2024 farm incomes will be 25% lower than in 2023. Those are tough numbers for anyone running a calculator. And a farm.
But what does that mean today?
Monitor your debt closely. That’s the advice from Brad Zwilling, a University of Illinois ag economist with Illinois FBFM.
Look at the numbers
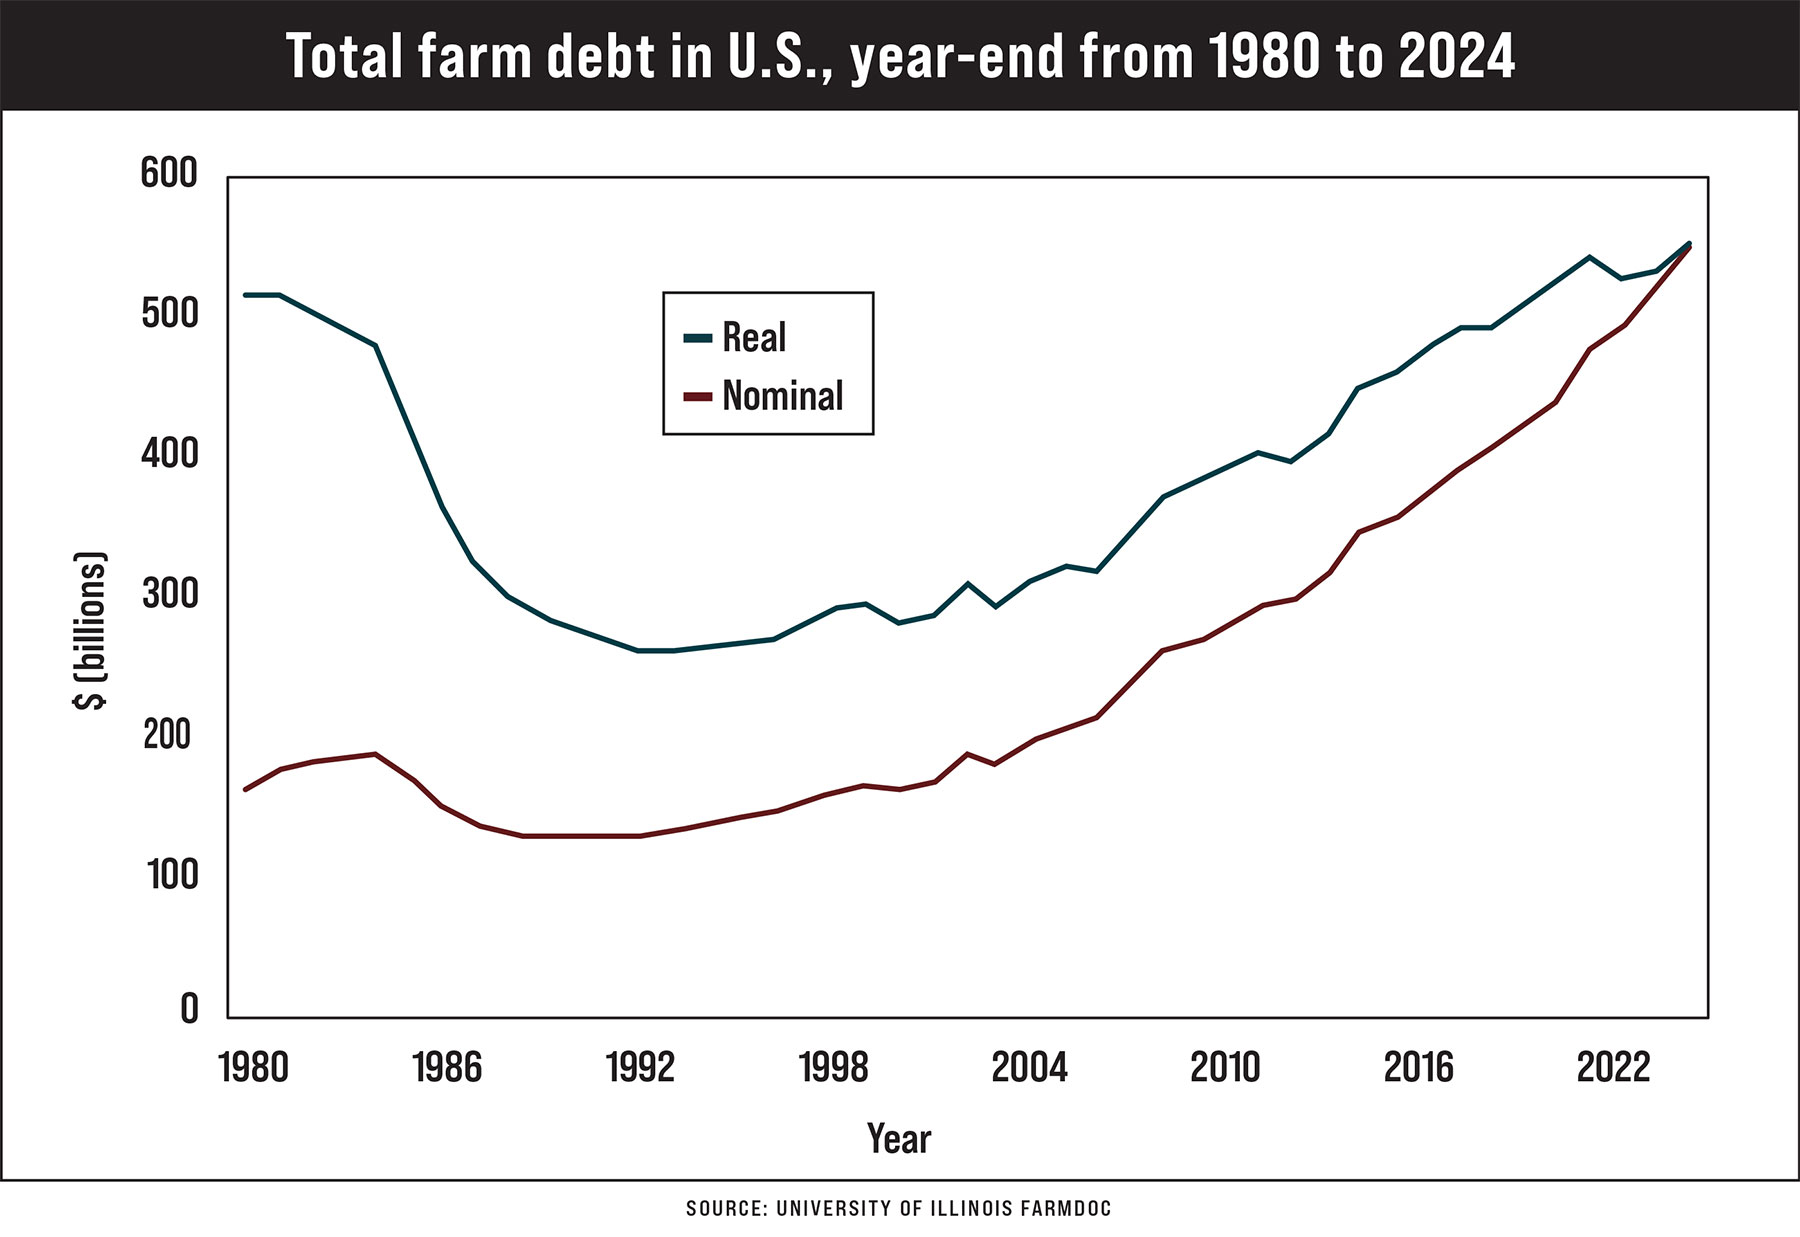
Agricultural debt hit a peak in 1984; then farmers steadily retired some debt, and lenders wrote off more, resulting in a 31% decrease in total agricultural debt by 1989. But since 1991, farm debt has steadily ticked back upward, at a rate of about 4.2% a year. There were a couple of bigger jumps in 2007 and 2014, and a couple of times when debt actually declined, like in 2003.
But overall, if you look at the chart (below), the line on the graph goes up. Looking at the blue line, in real dollars that account for inflation and show debt over time in 2024 dollars, agricultural debt started at $515 billion in 1980. It declined until 1994, and then climbed back up — and the number forecast for 2024 is the highest level in real terms. 2021 comes in second at $537 billion.
Those are big numbers. But all the numbers are bigger today. Farms in general are larger, and all the numbers we deal with as farmers are larger than they were 20 years ago — both assets and liabilities. The margin for error is larger, too.
Zwilling says the importance a farmer puts on monitoring their debt level will be increasingly important right now, given higher interest rates and inflation. Lower farm incomes mean higher debt per acre. Higher interest rates mean higher interest expense, too.
“A 1% increase in the average interest rate on all farm debt would lead to an $8-per-acre-increase in interest expense per acre, based on 2022 debt levels,” Zwilling reports.
Watch your term debt ratio, too, he adds. That’s income available compared to term debt payments. The bigger the number, the bigger the margin to meet all payments.
Farmdoc has a set of Excel spreadsheets called FAST, for Farm Analysis Solution Tools, to help farmers analyze numbers across categories like debt and breakeven, crop insurance, farm rent, and more. If you haven’t checked them out, this is a good time to take a look.
We don’t know a lot right now about how the 2024 growing season will go, but we know this: It’s gonna be a good year to keep your records up to date and your spreadsheets sharp — no matter how you manage debt.
Comments? Email holly.spangler@farmprogress.com.